Figure 27
This study (presented in detail in Section IV.3.E) describes how consumers perceive the marketed brands. Respondents are asked to rate the physical characteristics of each brand on a scale from 1 to 7. In the example below, consumers have rated the brand MOST at 2.4 on the Power scale because they perceive it as being less powerful than brand ROLL, rated at 5.3.
|
MOST (2.4) |
ROLL |
(5.3) | ||||||||||||
|
Low
ê |
|
Average |
ê |
High | ||||||||||
|
|
|
|
|
|
| |||||||||
|
1 |
2 |
3 |
4 |
5 |
6 |
7 | ||||||||
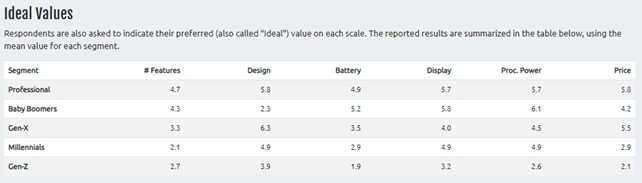
The study also provides the
ideal rating for each characteristic and each segment. The
results of this study are shown in Figure 26 and
Figure 27
. By comparing the perceived ratings of your brand with the ideal ones for a given segment, you can determine if this brand fits the needs of consumers in that segment.