Ideal points, also called preferences, represent the needs of consumers in a given segment. They are calculated by averaging the individual responses of all respondents. As explained in the chapter introduction, consumer needs are likely to evolve over time. This may be due to changes in the environment, to new trends, or to new ways to use Sonites and Vodites products. Consumer needs are also influenced by the actions of competitors (for instance new products introductions and large scale advertising campaigns).
None of these reasons will create the conditions for drastic changes in consumer needs. On the contrary side, the tracking of the position of ideal points on the map shows that this evolution is fairly gradual and regular. Two charts are available to help you predict where ideal points will be in future periods.
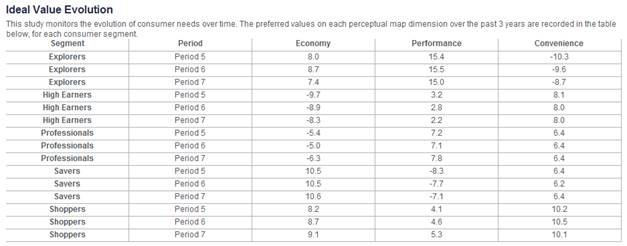
•The table depicted in Figure 56 is included in the Multidimensional Scaling study as of Period 2. A similar table is also included in the Semantic Scales study. Positions are tracked over only three periods but you may use the graphs described in the next paragraph to obtain a longer tracking.
•The graph depicted in Figure 57 is included in the additional graphs available both in the Semantic Scales and Multidimensional Scaling studies. It shows the evolution of ideal points since the beginning of the simulation. The latest data point is the one with the strongest color. All dimensions can be plotted by using the choice boxes on the left-hand side.
Figure 56 – MDS Study – Ideal value evolution – Table
Using these charts, you can interpolate where ideal points will be located in few periods time. This is an important step in your positioning strategy. Indeed, you want to choose a position for your brand that will be close to the needs of consumers for several periods. In addition, you should take into account the time it will take to reach this position, especially if a research project is necessary. Hence, you probably need to look 2 or 3 periods ahead of time, if not more.
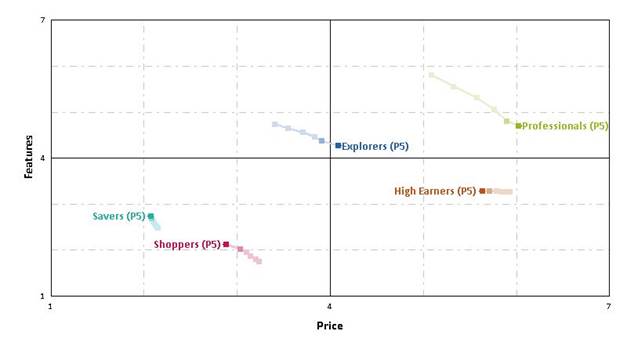
Figure 57 – Semantic Scales Study – Ideal value evolution – Graph