Eco-Score Performance
![]() The Eco-Score Performance
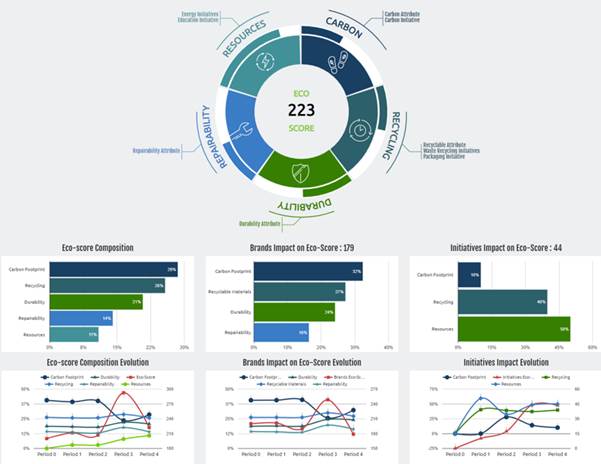
report is first made of a circularity wheel (Figure 12) that concretely identifies
the circular dimensions (steps) that you have been working on (Durability,
Repairability, Resources, Carbon and Recycling) and the efforts still to achieve
for each step (see section II.1 for details).
The Eco-Score Performance
report is first made of a circularity wheel (Figure 12) that concretely identifies
the circular dimensions (steps) that you have been working on (Durability,
Repairability, Resources, Carbon and Recycling) and the efforts still to achieve
for each step (see section II.1 for details).
![]() This report also helps
you understand how your current eco-score got constructed. Starting from the
equation mentioned in section II.7:
This report also helps
you understand how your current eco-score got constructed. Starting from the
equation mentioned in section II.7:

(i) (ii)
Charts in Figure 12 show how the global firm Eco-Score can thus be broken down between:
-
Eco-scores of company brands: “Brands impact on Eco-Score” (= 179 in the example in Figure 12)
-
Circular initiatives: “Initiatives impact on Eco-Score” (= 44 in the example in Figure 12)
Knowing that both add up to the global firm Eco-Score (179+44=223 in the example in Figure 12).
Regarding (i), more specifically:
-
Brands’ eco-score: depends on the physical circular attributes of this specific product: brands’ Eco-Score evaluates how much each circular attribute moves away *from the minimum value of the attribute, this minimum evolving with government eco-taxes on attributes (*or from the maximum value, regarding the carbon footprint attribute). A maximum value of 100% for a brand’s eco-score would mean that this brand undertook all possible efforts on each physical circular attribute.
In Figure 13, the table “brand’s eco-score” shows that brand MOST moves away from the minimum values of the circular attributes by 68%. As 68% is the highest brand’s eco-score among this company’s brands (the lowest being linked to MOOD with 23%), it implies that the company is doing its biggest circular effort with MOST.
-
Weightbrand : is measured by Brands’ impact on eco-score (per brand). It is the proportion of the number of units sold for each product, compared to the total number of units sold for all brands of the company: the more units of an environmentally friendly product you sell, the higher will be its weight on the company eco-score. In Figure 13, MOST and MOVE represent the highest percentages in terms of units sold (respectively 39% and 38%, all brands not surprisingly adding to 100% of the units sold).
-
Lines in “Evolution of Brand Eco-score” and “Evolution of Brand Impact on Eco-Score (per brand)” represent the evolution of these percentages, period after period.
Figure 12 also shows how the five dimensions (steps) of Circular Economy (Durability, Repairability, Resources, Carbon and Recycling) influence the global eco-score and the two elements composing this eco-score:
-
Eco-Score composition: shows how each dimension contributes to the global company eco-score. In the example (Figure 12), carbon footprint contributes to 29% of the eco-score (the 5 contributions, respectively of 29%, 26%, 21%, 14% and 11% adding up to 100%).
These percentages are obtained by multiplying each dimension weight on the eco-score by the efforts made on the dimension by the company, and then normalized to 100%:
-
weight of each dimension on the eco-score: dimensions are not equally important in determining the eco-score, and this is common to all companies. The weights correspond to the importance of the dimensions in the purchase intention found in the semantic scales report.
-
circular efforts made by the company on this dimension (specific for a given company).
-
It means that a “lower weight” dimension (e.g. durability) may contribute more to the eco-score of the company than a “higher weight” dimension (e.g. carbon) if the company sells products with a particularly high level of durability.
-
Brands’ impact on eco-score (per dimension) : shows how each dimension, when focusing on brand circular attributes (carbon footprint, recyclable materials, durability, repairability attributes), contributes to the global eco-score. 12 shows that the carbon footprint attribute contributes to 32% of the global eco-score, meaning that it is the attribute with the highest impact on the eco-score for this specific company (the contributions of the 4 attributes, namely 32%, 27%, 24%, 16%, adding up to 100%).
-
Initiatives impact on eco-score (related to (ii) in equation): shows how each dimension, when focusing on initiatives (global carbon footprint initiative, recycling initiatives, resources initiatives), contributes to the global eco-score. 12 shows that the resources initiative contributes to 50% of the global eco-score, meaning that it is the initiative with the highest impact on the eco-score (the contributions of all initiatives, namely 10%, 40%, 50% adding to 100%).
Lines in “Evolution of Eco-score composition”, “Evolution of Brand Impact on Eco-Score (per dimension)” and “Evolution of initiatives impact” simply represent the evolution of these percentages, period after period.

Figure 12 - Eco-Score performance report – part 1

Figure 13 - Eco-Score performance report – part 2
-