

Drawing the Current Industry Value Curves
Based on the information on the competitors and their products in the section “Introduction to the BOSS world” from the Student Handbook, your first task is to draw the Value Curves of the competitors in the industry.
A wizard is built into the BOSS to help you draw the current Value Curves for the competitors. It automatically creates the overall industry Value Curve. You can do this by selecting the “As-Is Strategy Canvas” in the ‘INPUT DECISIONS’ menu. The first form of the wizard pops up, as shown in Figure 1 below.
Initially, all Value Curves are at the “Average” level. The Canvas shows only the 8 competing factors that the industry competes on in the Red Ocean.
You can create the Value Curve of a specific competitor by clicking on its name in the ‘Brand’ drop-down choice box and then selecting the appropriate level for each of 8 competing factors. Repeat this action for each of the four Red Ocean competitors. At any time, you may visualize the four Value Curves by clicking the right-arrow button at the bottom of the page.
You may then click on the right-arrow button view the industry value curve, based on the levels that you have just entered for the four competitors. Finally, you may click the right-arrow button one more time to view an automated grading of your As-Is Value Curves. If you are not satisfied with your score, your may go back to the beginning and adjust your Value Curves, perhaps after re-reading the information on competitors in the section “Introduction to the BOSS world”.
|
|
|
|
|
Step 1 – Set Levels for each Value Curve |
|
Step 2 – View Value Curves |
|
|
|
|
|
Step 3 – View Industry Average Value Curve |
|
Step 4 – View Automated Grading |
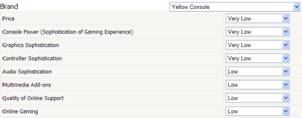
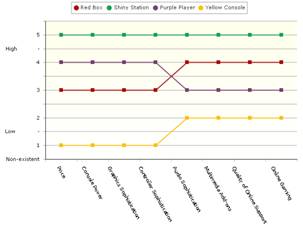
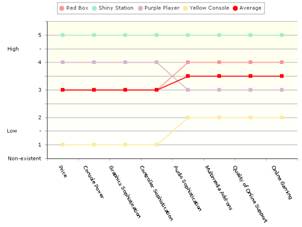
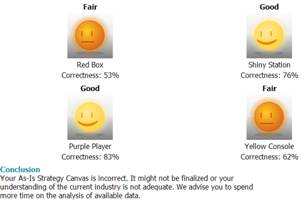
Figure 1 - As-Is Strategy Canvas Wizard
When all the Value Curves are drawn and you have correctly captured the strategic profiles of the competitors (including Blue Buddies), you are advised to discuss the shapes of the Value Curves, how they differ from each other and draw a conclusion about what the industry’s overall Value Curve depicts. This step is called Visual Awakening.
Finally, you may want to develop a ‘tagline’ which captures the essence of each competitor’s offering.